
Sermon views
Which messages are people choosing to watch?
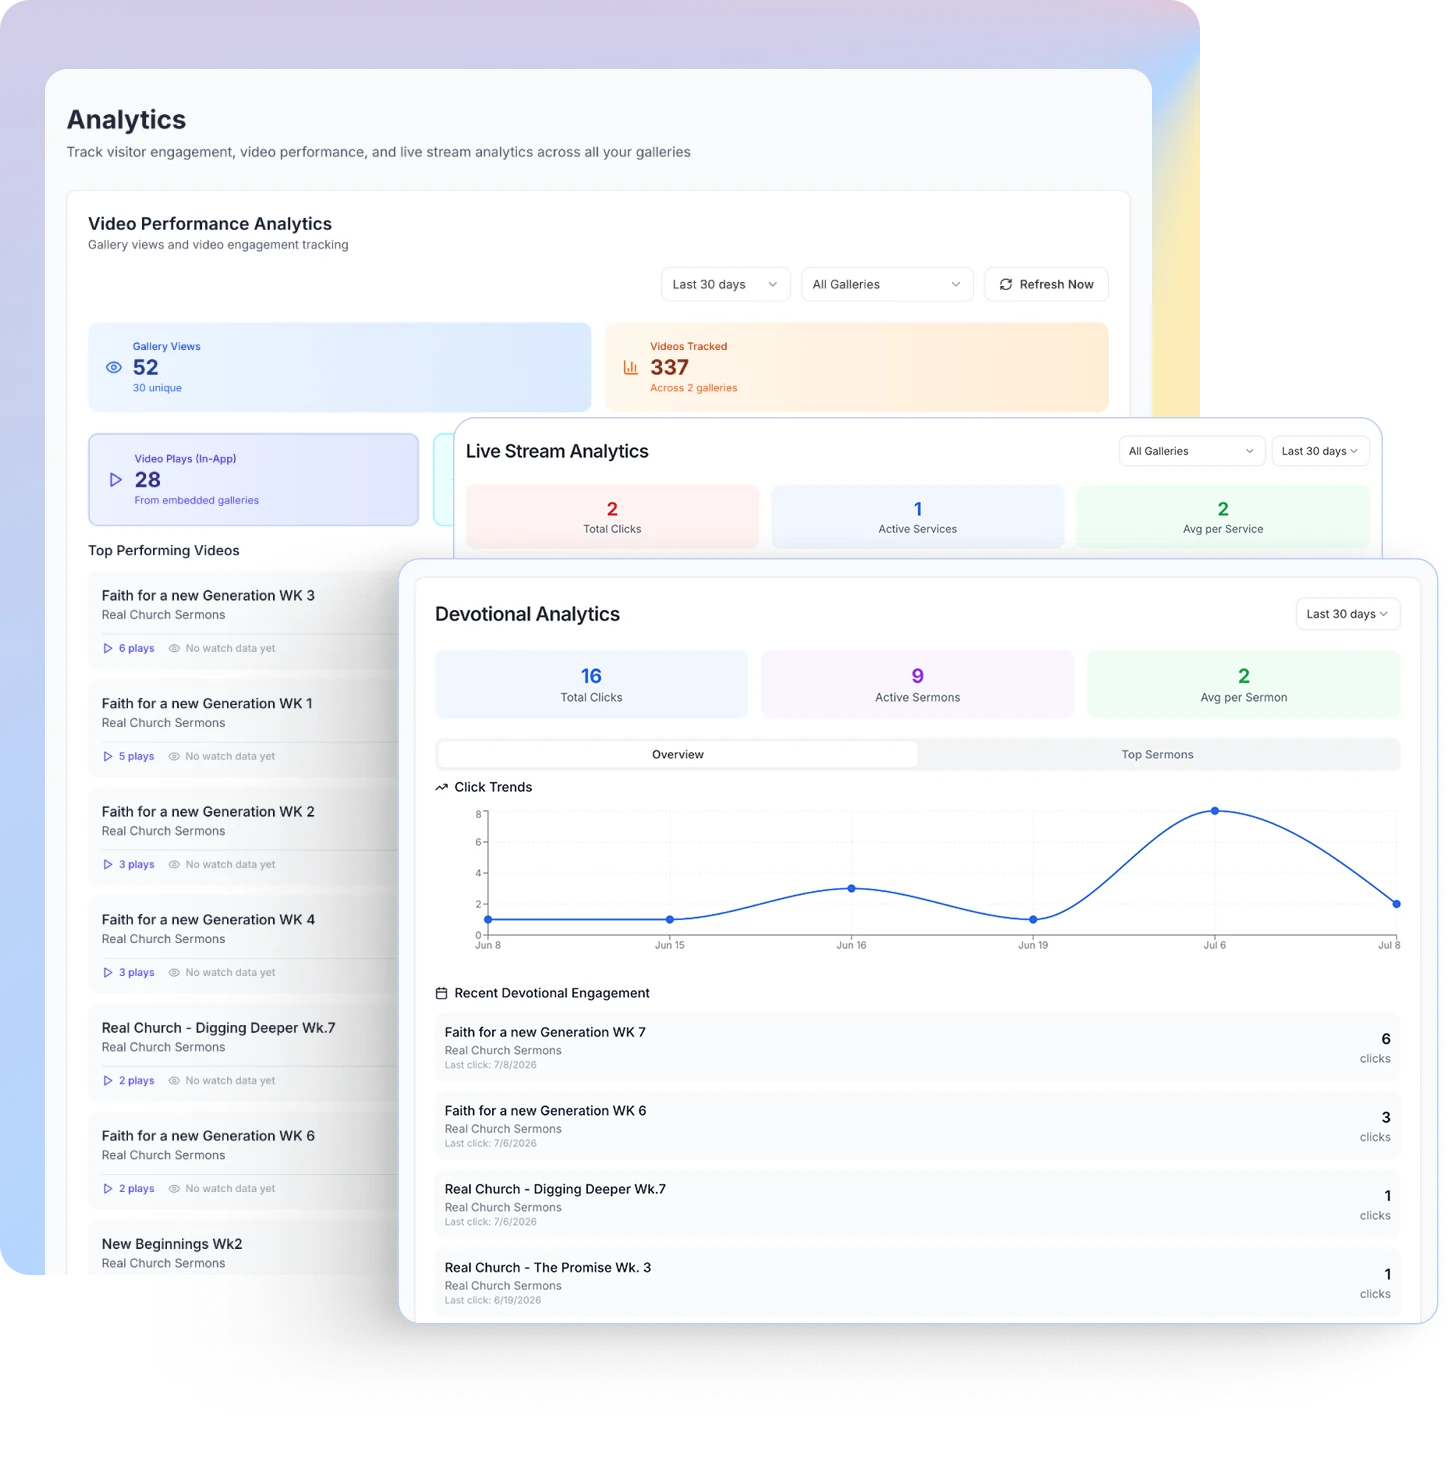
Sermon Engagement Analytics
Which sermons do people watch? How much do they view? Which devotionals and livestream links do they follow? SermonGallery gives pastors and communications leaders practical signals about where the message continues.
Why it matters
On Sunday, you see the people gathered in front of you. After the service, someone may watch from home, return to an older message, open a devotional, or click into the livestream.
Which messages are people choosing to watch?
How much do people actually watch?
When a sermon leads someone further.
Which services are visitors choosing to join?
Where might the church create another path for a message already serving people?
How it works
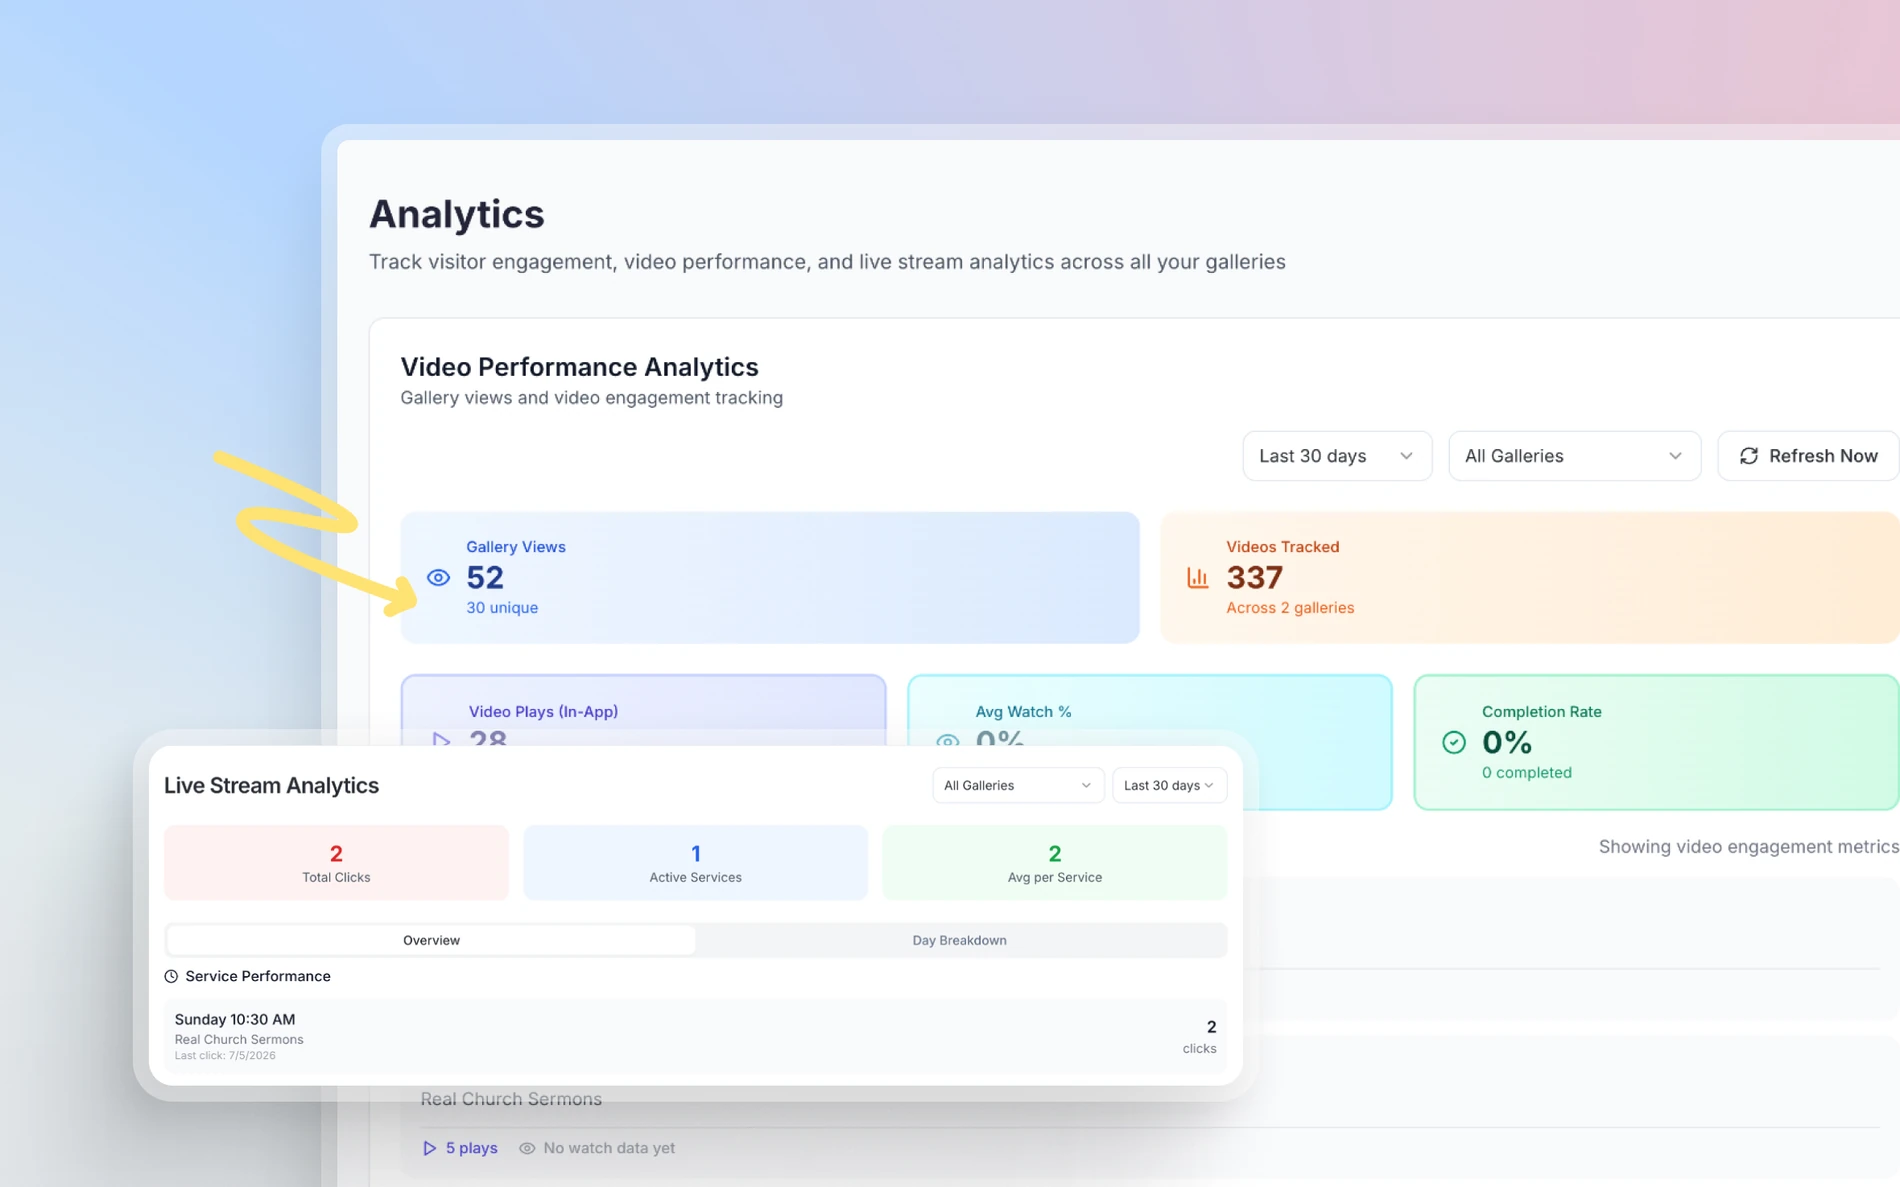
Your church should not need a data analyst to understand the basic signals around its sermon library. The most useful measures stay together in one view so your team can notice what deserves attention and return to the work of ministry.
Track sermon views and average watch percentage.
Notice devotional and livestream clicks from the gallery.
Use practical signals, not vanity metrics, to decide what serves next.
Built around the message
Use practical sermon analytics to understand what people watch and which next steps they choose.